 |
Governance Metrics International Research
Governance Metrics International (GMI) is the first corporate governance research and ratings firm to track the number of women corporate directors sitting on boards they survey and evaluate for corporate governance performance. In March 2009, GMI produced their first report, entitled: "Women on Boards." One year later, In March 2010, they reported noteworthy changes in data which we summarize here.
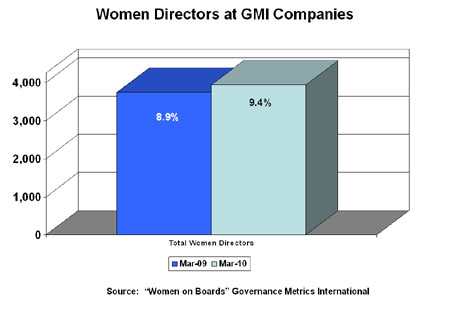
In March 2010, a total of 41,926 directors served on 4,217 global company boards, an increase of 15 companies in the sample, but 196 fewer overall directors compared to a year ago. In March 2009, 8.9% of all directors were women, while this year 9.4% are women (an increase of 0.5%) or 196 more women directors than reported in the earlier survey.
When we look at top tier S&P 200 boards, the share of women directors usually is around 16%. Among Fortune 500 firms, the percent usually is about 15% and 14% for the Fortune 1000 firms. When we take a sample size of over 4,200 global firms, as GMI is doing, we include many more firms with zero or only 1 woman director and thus tend toward lower percentages.
|
 |
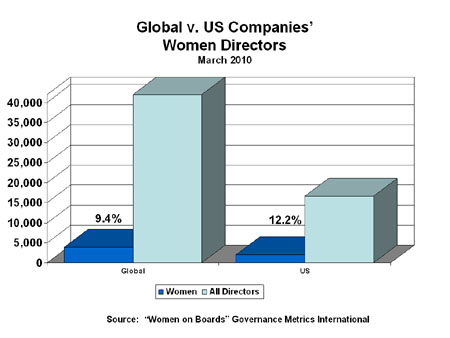
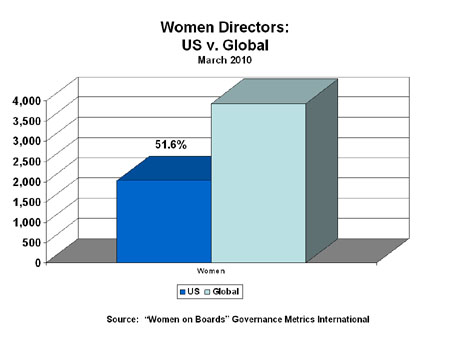
The subset of US women corporate directors, as of March 2010, is 12.2% or almost 3% points higher than companies around the world. US women directors represent almost 52% of all the world's women corporate directors in this global sample.
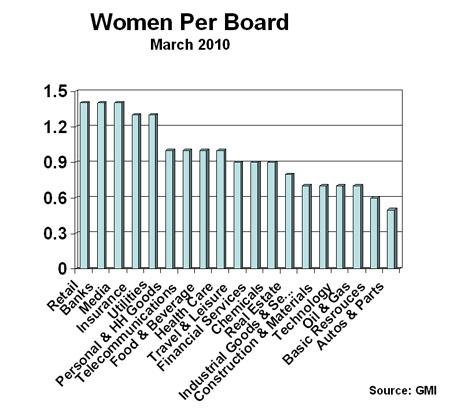
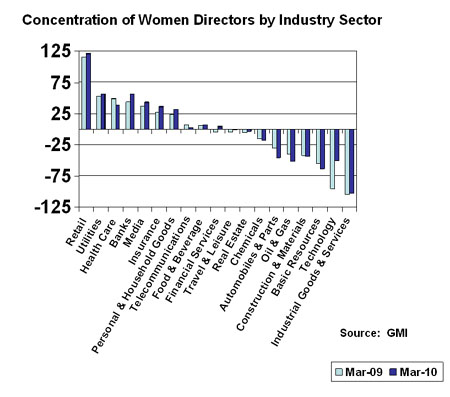
Women directors in the 19 industry sectors surveyed by GMI range from a high of 1.4 down to a low of 0.5 women per board. This raises the question about how valid are academicians' conclusions about the alleged "magic of three women per board" given how very few boards ever come close to reaching that number. Only 8.5% of companies have at least 3 women directors (a total of 348 companies, 4 fewer firms this year than in last year's survey).
This chart also introduces the important concept of how women distribute themselves across industry sectors. The lowest average shares of women directors are in half the industry sectors: including surprises such as real estate, travel and leisure, telecommunications, and technology.
In the next chart, by industry sector, the actual number of women directors is compared to a hypothetic "norm" (i.e., if each sector had "the average" or 9.4% women directors). In this way, we see graphically how significantly women over-fill board seats in certain sectors and under-fill board seats in other sectors. |
 |
The tendency to follow other women into board positions in the same limited industry sectors probably is partially a reflection of the education, experience, and capabilities women bring to their management leadership. This chart simply shows the tremendous opportunities that exist in "non-traditional" businesses and industry sectors.
We are beginning to see many more women take on engineering, science, and math degress. We are beginning to see more women take on business degrees in finance, economics, and other competencies that will prepare them for top leadership jobs, not simply in the softer professional positions in marketing, public relations, communications or human resources.
There is no question that women, when they properly prepare themselves, can take on the challenges of leadership across industry sectors. We are seeing more women in utilities, energy sectors, and other "hard science" professions. And they are very good. |
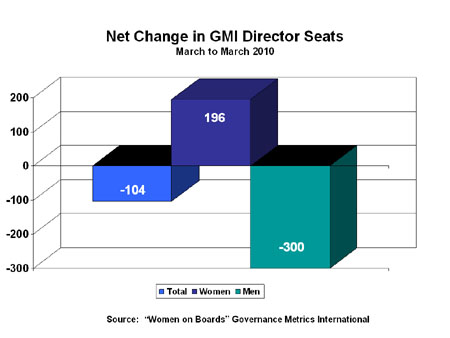 |
The GMI data also confirms another trend noticed in other data about women corporate directors. The total number of corporate directors for the companies surveyed declined by 104 members. The total number of women directors increased by 196. Taking these two figures together means that male directors vacated a greater number of seats: a total loss of -300 male-occupied seats.
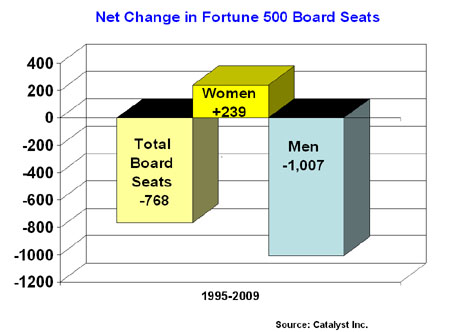
We have seen this pattern before, but we have not heard any discussion of the issue or its ramifications. We first saw the pattern in the Fortune 500 board seat data tracked by Catalyst Inc. covering the period 1995 to 2009. We saw the same pattern in the FTSE 100 board seat data covering the period 1999 to 2009. (See the two charts below.) In all these cases, it is women who are being added to boards, here and abroad.
As Edmond H. Perdergast, President of Pendergast & Co., said in a recent issue of Dirctorship Magazine (published by the National Association of Corporate Directors), "Diversity in the boardroom is looked at differently than diversity in the public." One possible interpretation of the data is that it suggests that women are being added to major corporate boards. If we want to make further progress, certainly an important element to be considered is how well women are preparing to take on the challenges remaining in "non-traditional" industry sectors and those business enterprises. |
We would add the following note of caution. There is a great deal of turnover of companies (and therefore boards) from year to year, making those comparisons a challenge. In our own recent evaluation of Los Angeles top 200 firms, we found that 50% (1016 companies) changed from 2008 to 2010. We also had tracked, earlier, the loss of firms from the Fortune 1000 level for California as a whole and for the Greater Los Angeles area in particular. This level of turnover means that new firms coming onto such lists may be evidencing a different profile from those that have departed: they may be smaller, they may be more likely to have diverse boards (meaning independent directors from a range of experiences and competencies). We could also suggest that those companies that departed had bigger boards that might not have been as diverse. Many factors are at work.
It will be interesting to finish our research into LA based firms because, when we last looked in 2004, their average share of women directors was 6.6% for the top 200 firms and 7.7% for their Fortune 1000 level firms. Will there be any improvement by 2010? Stay tuned!
© 2010 by Technology Place Inc.
|
 |
 |

|
|